Try Default

See how revenue teams automate revenue operations with Default.

Key Takeaways
In most go-to-market teams, reporting feels like a scavenger hunt.
Sales has a number of opportunities and close rates in the CRM.
Marketing tracks MQLs, demo requests, or website activity in the marketing automation platform.
And RevOps is left trying to turn fragmented numbers into a narrative the whole company can understand.
Reporting is a mess of disconnected data, inconsistent definitions, and manual work that is painful and leads to no one knowing the answer to basic questions.
Questions like:
- How many demo requests did we convert?
- How fast are we responding to inbound leads?
- How many meetings are actually happening each week?
To get a full picture of inbound performance, most teams are hopping between platforms, exporting data, syncing spreadsheets, double-checking formulas, and praying nothing breaks before the board meeting.
Not anymore.
Introducing: Dashboards
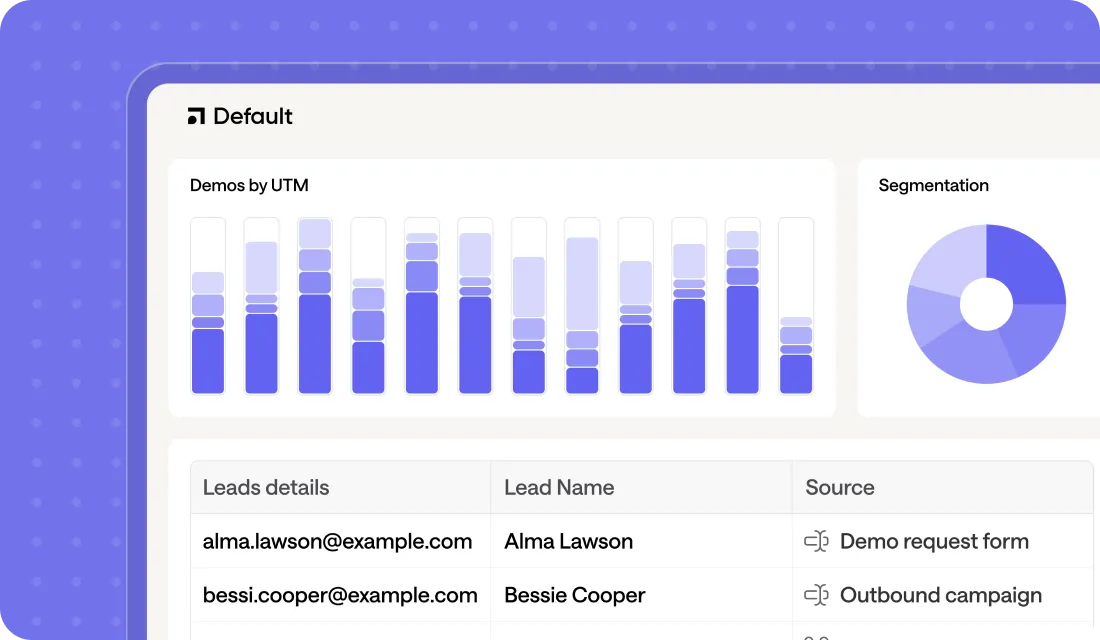
Default Dashboards gives you clarity across the entire inbound funnel - without spreadsheets, exports, or duct-taped CRM reports. Now you can see what’s happening, what’s working, and what needs fixing in one place.
Inbound Funnel Conversion
Default brings the full inbound journey into one view: form submissions, qualified leads, and meetings booked, lined up, and easy to track. This is your true funnel, finally connected.
You’ll know exactly where leads are getting stuck, and what’s moving them forward. Default Dashboards unlock a new way for go-to-market teams to compare conversion rates by campaign, form, or specific UTM parameters. All from one platform.

Form Submissions Over Time
You can’t forecast a pipeline if you don’t know what’s coming. Default Dashboards let you track form submissions week by week, so you always know how top-of-funnel is trending. Whether it’s forecasting future pipeline or assessing campaign performance, this is your early signal for what’s ahead.

Speed-to-Lead
We all know the faster you respond, the more likely a lead converts. But tracking how long it takes from form submission to meeting? That usually means messy exports or complex Excel formulas. Doable? Yes. But very time-consuming to monitor consistently.
Now, Default turns speed-to-lead from a KPI to a competitive advantage. With Dashboards, you can see the average time from submission to the meeting held, broken down by week and by a rep. Now you can spot who’s moving fast, where follow-up slows down, and how small changes to routing or qualification impact results.

Weekly Meeting Activity
Are reps overloaded? Are leads flaking? Are things trending up or quietly slipping? Default Dashboards give you a weekly view of meetings booked, rescheduled, and cancelled - so you can understand the rhythm of your GTM motion.

Meeting Booking Rate
With Dashboards, you can see the percentage of leads that turn into booked meetings, updated weekly. This helps you measure impact across the funnel, from changes in your messaging to tweaks in your routing logic. High form volume doesn’t mean high conversion. But without a clear view, it’s hard to know where things are breaking down.

Meeting Hotspots
Reps get buried with meetings on Mondays. Prospects always book on Thursdays. But unless you’re manually scrolling through calendars, it’s hard to see patterns.
Dashboards visualize when your team is taking meetings, by day and time, so you can better manage calendars, reduce no-shows, and optimize rep availability around real behavior, not gut feel.

Try now
Start using Dashboards today and give your team a reporting layer that works because your reporting should work as fast as your GTM team does.
Conclusion

Former pro Olympic athlete turned growth marketer. Previously worked at Chili Piper and co-founded my own company before joining Default two years ago.
Run revenue as an engineered system
Revamp inbound with easier routing, actionable intent, and faster scheduling


.png)
.svg)


